Liveblogging Erez Lieberman Aiden and Jean-Baptiste Michel’s presentation on Culturomics: Quantitative Analysis of Culture Using Millions of Digitized Books at the Berkman Center. Please excuse misrepresentation, misinterpretation, typos, and general stupidity.
Erez Lieberman Aiden and Jean-Baptiste Michel have assembled a digital collection comprising approximately 4 percent of all published books — or around 5 million titles printed since 1800 — and are analyzing it to reveal trends about everything from technological adoption to the pursuit of fame. (Interested in checking it out for yourself? The data is available via Google.) They call this field of study “culturomics,” which they define as research that “extends the boundaries of rigorous quantitative inquiry to a wide array of new phenomena spanning the social sciences and the humanities.”
There are two basic ways to approach a library, Erez and JB say. You can read a few books very carefully, or you can read all the books “very not carefully.” Their hope is to give people a way to pull useful information from all the books without having to read all the books carefully.
Awesome
They start with an example of culturomics: quantifying the usage of irregular and regular verbs to help track how language changes over time. In an earlier project, they scoured 11 early English texts and manually counted the instances of different verbs. They found that verbs with a higher frequency in these texts (to be, to have) have remained irregular, while verbs with a lower frequency regularized more quickly — if a verb was 100 times less frequent, it regularized 10 times as fast. In other words, when English speakers rarely use a word, they tend to fall back to the standard pattern of conjugation rather than preserve irregular forms.
While this research is awesome, it is not practical, Erez says. (Particularly given that they had hoped for 1000 undergraduate students to assist them in the counting but were only able to entice one.) So they set out to make something both awesome and practical.
Awesome + Practical
JB says that the ideal way to begin a project like this would be for Google, which has digitized millions of books, to simply release all of this data to the world. “But 5 million books is 5 million authors, which is 5 million plaintiffs,” he says. So instead of using the full text, they convinced Google to release statistics: n-grams. A gram is a word, a 2-gram is two words, a 4-gram is four words (e.g., “United States of America”). They worked with Google to publish this data for approximately 5 million books printed in the last two centuries.
This data has enormous potential to help track cultural evolution, they argume. Six months ago, JB says, if you wanted to know about the history of the past tense of the verb “to thrive,” you’d “ask two distinguished scholars with fantastic hair”: the scholar in 2000 would say that people “thrived,” while the scholar from 1800 would say that people “throve,” and that would be that. You would know the past tense had changed, but you wouldn’t know when, or how quickly.
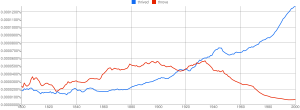
With n-grams, however, you can more precisely track the usage of both “thrived” and “throve” in 5 million books published over the past 200 years, showing that usage of “throve” has been steadily in decline since 1900, while “thrived’ has been on the rise. This kind of analytical power is “1 billion times more awesome” than anything you could do before, JB says.
Incredibly Awesome
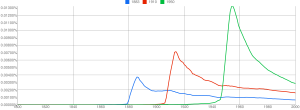
Verb usage and linguistic change aren’t the only things that can be tracked with n-grams. Erez and JB plugged the years 1883, 1910, and 1950 into the system to track mentions of these years over time. The usage of “1950” in published texts spiked in 1950 (“Nothing made 1950 interesting like 1950,” Erez says), but by 1954 it was declining. The same thing happened with 1883 and 1910, but with two interesting factors: overall, printed books talked more about 1950 than they did about 1883 or 1910, suggesting that we’re more interested in time than we used to be. However, the half-lives of these terms grew shorter — we talked more about 1950 than we did about 1883, but we stopped talking about it faster than we stopped talking about 1883, suggesting that we’re less interested in the past than we used to be.
Another example is tracking fame: Erez and JB tracked the names of the most famous people born in each year since the 1800s and were able to figure out how old the “class” of each year’s group of celebrities were when they achieved fame, how quickly they shot to stardom, and how long it took for society to forget them. Over time, people have become famous earlier, shot to stardom faster, and been forgotten sooner. Erez and JB were also able to determine that actors become famous at the youngest age, while politicians and authors, who take longer to become famous, become the most famous. (They recommend avoiding becoming a mathematician, as, historically speaking, they’re not very famous at all.)
To explore censorship, Erez and JB tracked mentions of Jewish painter Marc Chagall in English (a steady rise over time) and German (a dip to zero during World War II). English-language mentions of African-American track star Jesse Owens have been high since the 1936 Berlin Olympics, at which he won four medals, but didn’t rise in German until the 1950s. In Russian, mentions of Trotsky were artificially low between the time he was assassinated and the advent of perestroika. In Chinese, “Tiananmen Square” stays more or less even between the 1970s and today, while mentions shoot up in English after the massacre in 1989.
In another exploration of censorship, Erez and JB took Nazi blacklists, which were separated systematically into fields (politics, literature, etc.) and entered them into the system, comparing mentions of these intellectuals’ names against names of prominent Nazis. Between the mid 1930s and mid 1940s, mentions of Nazis went up 500%, while mentions of political scholars dropped by 60%; philosophers 76%, etc. This pattern held for individuals as well (for example, Henri Matisse). JB notes that every name on Wikipedia could be entered into the system to create “distribution of suppression indices” in different languages. He’s careful to explain that this does not replace the work of historians, but complete it.
Next Steps
Erez and JB approached Google with their prototype and asked them to create a web-based version; Ngrams. In addition to running simple comparative analyses of phrases and words, the system lets you view examples of these phrases and words in context. The system has proven quite popuar: within the first 24 hours, over a million queries were run.
They suggest that Ngrams could be part of a front end for a digital library — in a digital environment it’s important to think beyond card catalogs, toward new interfaces. Their research started with books, but newspapers, maps, manuscripts, art, and other cultural works are increasingly being digitized. Culturomics can be applied to these sources as well. JB argues that we don’t need to wait for copyright law to change in order to conduct this research — many of the books in their corpus are still under copyright, but because they didn’t release the entire text, they were still able to share important and useful data with the public.
Q+A
Q: Could this data be used for forecasting? To project culture?
A (Erez): You have to be careful, but one ought to be able to make some sorts of predictions based on observable linear trends in the data. We should push our boundaries.
A (JB): There’s a lot to be done with aggregates, but it’s harder for individuals.
Q: Have your data proven any “small-n historians” wrong?
A (JB): Not yet, but we’re hoping that this can be a tool to help historians generate hypotheses as starting points for discovery, and perhaps to prove or disprove these hypotheses. The problem is that these need to be quantitative hypotheses, which is not how most hypotheses tend to be formulated.
Q: What are the intellectual property and copyright implications of your work?
A (Erez): The approach that’s being taken with many of these digitization projects is to push for copyright reform in order to make these projects possible. That’s true to some extent, but the Ngrams system allows Google to make use of in-copyright books they’ve digitized that they can’t display in full. That’s an argument for digitizing even in-copyright books.
Q: Does the corpus have enough structural information in it so that you know where words appear (for example, book titles vs. chapter titles vs. subheads, etc.)?
A (JB): It was a challenge to make sure that the book was actually written in the year in which it said it was written. Tracking other types of data is even more challenging. Possible, theoretically, but challenging.


“This kind of analytical power is “1 billion times more awesome” than anything you could do before, JB says.”
‘Incredibly Awesome’ is right! All that data just makes me giddy.
Thanks for posting!